Warning: count(): Parameter must be an array or an object that implements Countable in /home/netprofitsexpert/public_html/wp-content/themes/newstar111/views/author_reviews.php on line 10
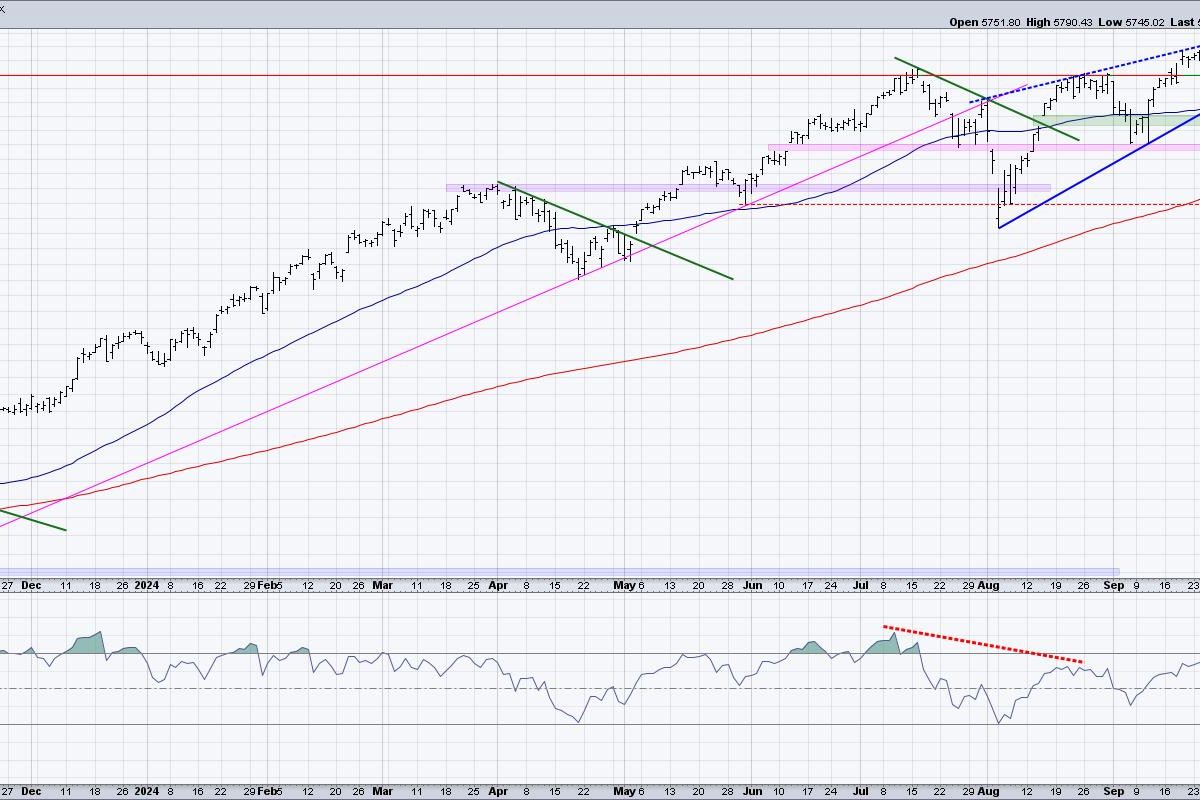
In this exclusive StockCharts TV video, Joe presents the price pattern to follow the recent breakout in the S&P 500. He discusses narrow range bars, wide range bars and when they are important. Joe then explains what needs to take place now to either confirm a breakout or a failure here; he briefly shows the Volatility condition of the SPY as well, and then analyzes at the QQQ and IWM. Finally, Joe goes through the symbol requests that came through this week, including BABA, PYPL, and more.
This video was originally published on October 9, 2024. Click this link to watch on StockCharts TV.
Archived videos from Joe are available at this link. Send symbol requests to stocktalk@stockcharts.com; you can also submit a request in the comments section below the video on YouTube. Symbol Requests can be sent in throughout the week prior to the next show.


