Warning: count(): Parameter must be an array or an object that implements Countable in /home/netprofitsexpert/public_html/wp-content/themes/newstar111/views/author_reviews.php on line 10
The risk-on sentiment has returned to the stock market. Stocks traded significantly higher ahead of the open on Wednesday after former President Trump’s victory. With the uncertainty of the election results out of the way, investors were ready to pile back into equities. All broader US equity indexes saw strong upside movement, and the Cboe Volatility Index ($VIX) fell, closing at around 16 (see screenshot of the Market Overview Dashboard Panel below).
FIGURE 1. THE STOCKCHARTS MARKET OVERVIEW DASHBOARD PANEL. All equity indexes closed significantly higher, while the VIX dropped.Image source: StockCharts.com. For educational purposes.
The stock market had priced in a Trump victory, but investors were clearly waiting for the result before adding more positions, although we saw signs of a head start on Tuesday ahead of the results. The strong upside move was apparent during the trading day, and the indexes closed near their highs.
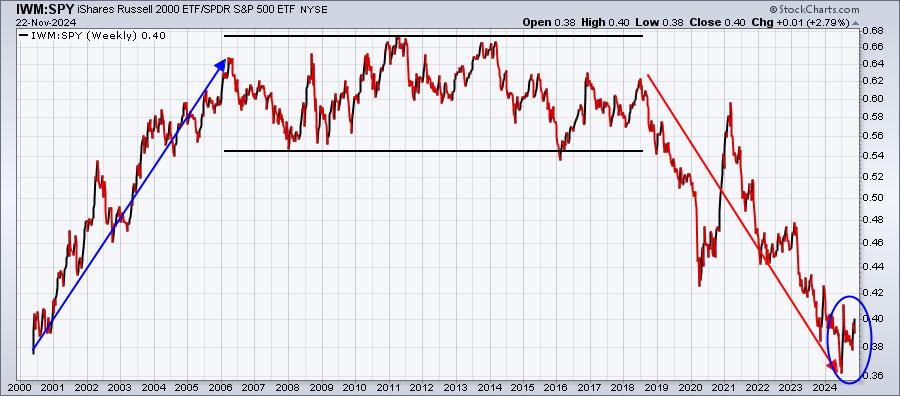
The biggest gainer was the S&P 600 Small Cap Index ($SML), which closed higher by 6.09%. Its big move is worth studying more closely, since it broke out of a trading range it has been in since mid-September (see daily chart below).
FIGURE 2: DAILY CHART OF THE S&P 600 SMALL CAP INDEX. The index broke through its trading range and gapped up. Market breadth is also positive.Chart source: StockCharts.com. For educational purposes.
The percentage of S&P 600 stocks trading above their 50-day moving average is at a healthy 78%, and the advances vs. declines also show increasing market breadth.
What’s behind the move in small-cap stocks? A boost in financial stocks. Financial stocks comprise a large fraction of $SML, and, with the possibility of deregulation and tax cuts on the horizon, the small-cap index spiked.
Financials Sector Leads
Financials were the leading sector in Wednesday’s trading. The StockCharts MarketCarpets of the Financials sector clearly show that many banks saw strong gains.
FIGURE 3. BANKS SAW LARGE PERCENTAGE INCREASES IN THEIR STOCK PRICE.Image source: StockCharts.com. For educational purposes.
This is clear in the chart of the KBW Bank Index ($BKX). Its performance relative to the S&P 500 ($SPX) jumped to 25.8%.
FIGURE 4. BANK STOCKS RISE. Wednesday’s massive surge is worth monitoring, as it could benefit bank stocks. Chart source: StockCharts.com. For educational purposes.
It may be worth considering adding bank stocks to your portfolio, especially when they pull back and until interest rates rise.
Crypto, US Dollar, Yields Rally
Cryptocurrencies are also rallying. $BTCUSD has broken out of its consolidation pattern with momentum (see weekly chart below).
FIGURE 5. BITCOIN SOARS. Bitcoin to US Dollar broke out of its consolidation pattern and the MACD shows rising momentum.Chart source: StockCharts.com. For educational purposes.
The moving average convergence/divergence (MACD) indicates bullish momentum as the MACD line crosses above the signal line.
The US dollar and Treasury yields spiked after Trump’s victory. This move could be in anticipation of an inflationary environment ahead. If inflation rises, the Fed may have to pivot and raise rates. We’ll probably not hear anything about that in Jerome Powell’s presser on Thursday. Still, it’ll be one to listen to, especially for clues of what could be in store for December. If bond prices continue to fall (bond prices move opposite to yields), expect a tapering in interest rate cuts by the Fed.
Disclaimer: This blog is for educational purposes only and should not be construed as financial advice. The ideas and strategies should never be used without first assessing your own personal and financial situation, or without consulting a financial professional.


